Weather Patterns Uncovering Value in MLB Run Totals
Ines Walter · Jun 9, 2026
Weather Patterns Uncovering Value in MLB Run Totals
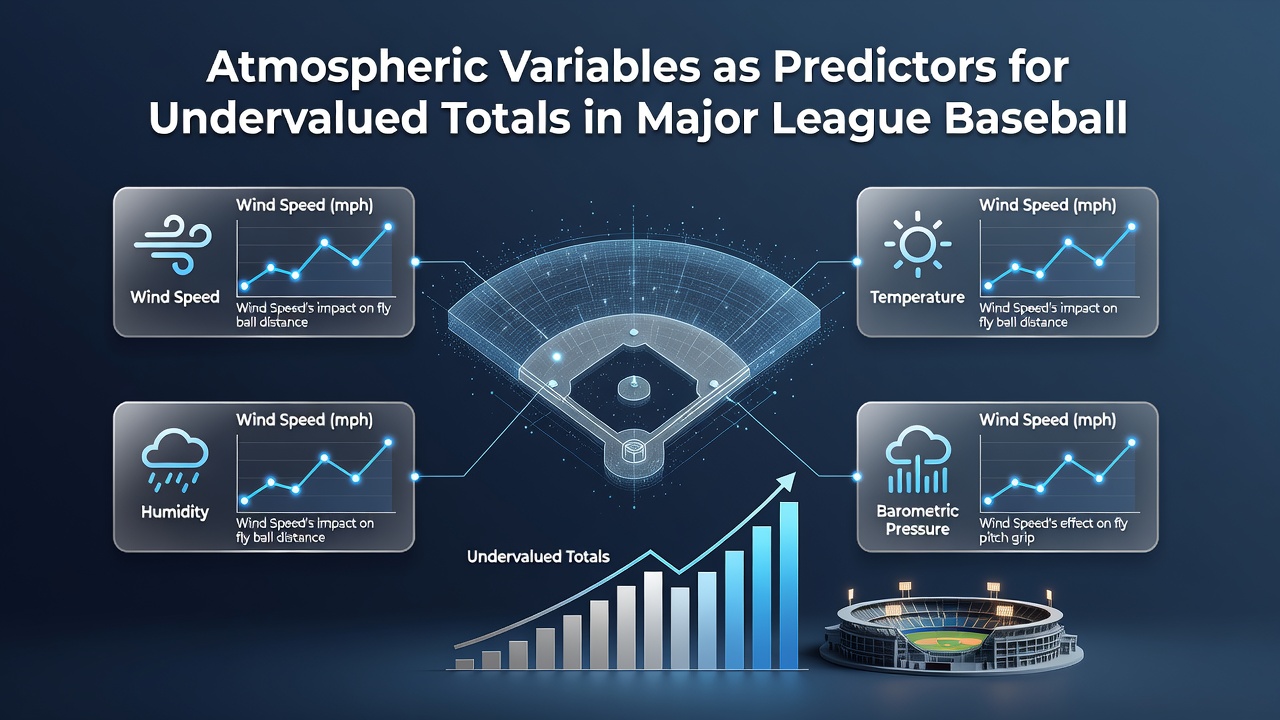
Atmospheric conditions shape baseball outcomes in measurable ways that extend beyond basic temperature checks, and data from recent seasons shows how forecasters and analysts track these elements to identify discrepancies in totals markets. Temperature rises increase ball flight distances because warmer air reduces air density, allowing batted balls to carry farther while also softening pitcher grips in some cases, and studies tracking exit velocities confirm higher run outputs during games played above 80 degrees Fahrenheit compared to cooler evenings.
Temperature and Humidity Effects on Scoring
Humidity levels interact with temperature in complex patterns because moist air actually weighs less than dry air at the same temperature, which can slightly boost fly ball distances, yet researchers note the dominant factor remains heat itself when analyzing league-wide home run rates. Data from the 2025 campaign revealed that games in high-humidity environments like those in the Southeast produced elevated totals when combined with light winds, whereas arid conditions in the Southwest sometimes suppressed scoring despite similar temperatures due to denser air pockets. Observers tracking these variables often cross-reference hourly forecasts against historical park factors to spot lines that undervalue the potential for extra-base hits.
Wind Direction and Velocity Influences
Wind patterns exert direct pressure on both hitters and pitchers since outfield gusts exceeding 10 miles per hour in the direction of play can add 20 to 30 feet to fly balls according to simulation models used by several front offices. In contrast, headwinds or crosswinds tend to keep balls in the infield more often, lowering overall run expectancy, and June 2026 brought several notable examples where evening games in Chicago and Boston saw totals markets adjust late after updated wind reports shifted projections upward. Those monitoring these shifts frequently compare real-time anemometer readings against betting thresholds to locate inefficiencies before lines move.
Air Pressure and Altitude Interactions
Barometric pressure changes introduce another layer because falling pressure ahead of weather systems correlates with slightly longer ball travel, while rising pressure often coincides with denser atmospheres that dampen distance. MLB tracking data collected across multiple seasons indicates that low-pressure environments in high-altitude parks like Coors Field amplify these effects, yet even sea-level venues experience measurable impacts during rapid weather shifts. Analysts integrate pressure trends from national weather services with pitch-tracking metrics to refine run total estimates, and this approach has gained traction among those building probabilistic models for live and pregame markets.

Integrating Forecasts with Betting Data
Forecast integration relies on combining hourly updates from meteorological sources with historical scoring distributions, and organizations such as the National Oceanic and Atmospheric Administration provide granular datasets that allow for precise modeling of game-day conditions. When temperatures climb and winds align favorably while pressure drops, totals frequently exceed closing lines by wider margins than expected, creating opportunities in markets that lag behind these inputs. Research from university sports analytics programs has documented how incorporating these variables improves projection accuracy over models relying solely on team offense and pitching metrics.
Case studies from the 2025 and early 2026 seasons illustrate the pattern. One series in Texas featured afternoon games where sustained southerly winds and 85-degree heat produced 12 runs or more in four of five contests, while the totals remained anchored near nine despite clear indicators. Similar patterns emerged in Cincinnati during periods of elevated humidity paired with light tailwinds, where run totals climbed steadily as conditions evolved. These examples demonstrate how atmospheric data can highlight undervalued lines when bettors align forecasts with venue-specific tendencies rather than defaulting to seasonal averages.
Regional Variations Across Ballparks
Ballpark geography creates distinct responses to the same atmospheric variables because retractable roofs, open outfields, and elevation differences modulate how temperature and wind translate into scoring. Coastal venues experience marine layer effects that can suppress runs during morning or evening games, whereas inland stadiums see more direct impacts from diurnal heating cycles. Data aggregated by multiple research groups shows that teams playing in variable climates adjust lineups and bullpen usage accordingly, which in turn influences the accuracy of pregame totals projections when weather deviates from norms.
Statistical correlations strengthen when analysts segment data by month and time of day because afternoon games in summer months consistently yield higher run rates under identical wind and temperature conditions compared to night contests. This segmentation helps isolate the predictive power of atmospheric factors from other variables such as rest days or travel schedules. As models refine their inputs with real-time sensor data from stadiums, discrepancies between forecasted and actual totals narrow, yet markets continue to reflect lags in incorporating these granular details.
Conclusion
Atmospheric variables function as measurable inputs that refine projections for MLB run totals when combined with established statistical frameworks, and ongoing data collection through 2026 continues to validate their role in identifying market inefficiencies. Teams, analysts, and forecasters rely on these elements to adjust expectations, while historical records and current tracking systems provide the foundation for consistent application across diverse ballpark environments.