League Timelines and Value Discovery: Emerging Spots Throughout the Season Calendar
Katja Simon · Jul 26, 2026
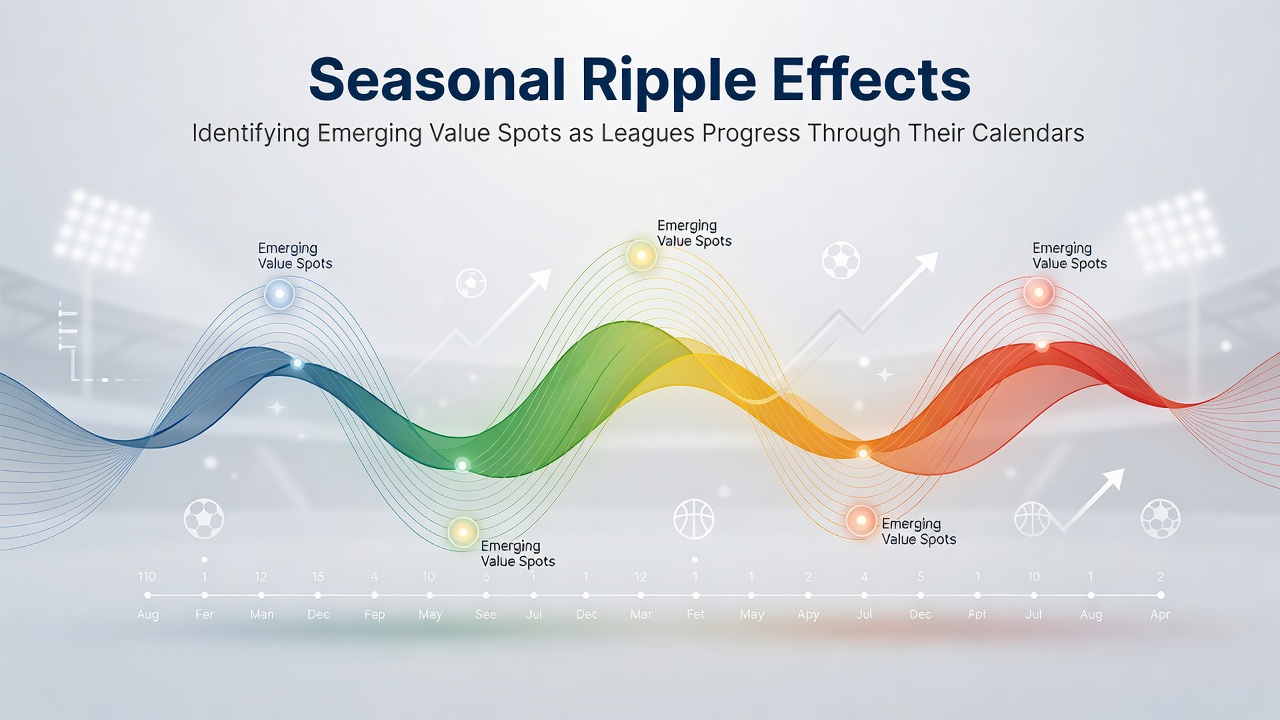
League Timelines and Value Discovery: Emerging Spots Throughout the Season Calendar
League schedules create predictable patterns that shift betting markets as weeks turn into months, and observers note how team fatigue, motivation levels, and fixture congestion alter outcomes in measurable ways. Data from various sports shows that early-season results often carry inflated weight in odds compilers while late-season adjustments reveal overlooked edges once standings clarify. Researchers tracking these calendar effects across soccer, basketball, and baseball have documented consistent drifts in totals and spreads that emerge after the first quarter of play, when initial optimism gives way to actual performance trends.
Early Calendar Stages and Overreactions
Teams begin seasons with uneven preparation, and bookmakers adjust lines based on limited samples that frequently overstate hot starts. Studies from university sports analytics programs indicate that win rates for newly promoted sides or teams with major roster changes stabilize only after eight to ten matches, creating windows where unders or overs on goals and points drift away from true probabilities. Those who monitor European domestic leagues alongside North American circuits find parallel behaviors where September and October fixtures produce higher variance than December equivalents because weather, travel, and recovery protocols have not yet settled into routines.
Mid-Season Congestion and Rotation Effects
Fixture piles create measurable dips in performance metrics once teams cross the halfway mark, and evidence from injury databases confirms elevated absence rates in leagues with packed midweek schedules. Analysts examining NBA and NHL datasets observe that back-to-back games after the All-Star break correlate with specific point total movements, while soccer sides balancing domestic cups and continental ties show altered pressing intensities that affect both goals scored and conceded. July 2026 pre-season windows already highlight similar preparation gaps for clubs entering new campaigns, as squads returning from international tournaments display slower starts in opening fixtures compared to those with extended rest periods.
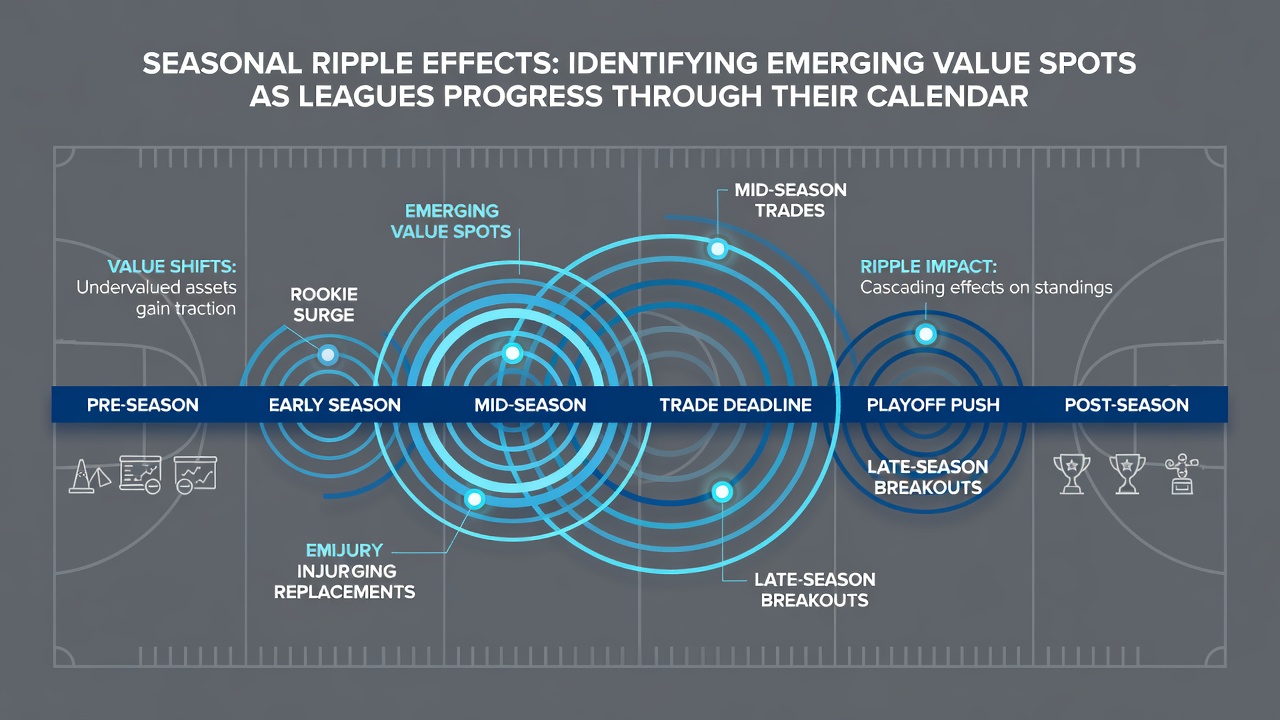
Betting exchanges reflect these shifts through volume spikes on player props tied to minutes restrictions and rest decisions, patterns that sharpen once coaching staffs publish rotation announcements. Data compiled by industry research groups demonstrates that totals markets in baseball tighten during August and September when bullpen usage stabilizes and starters face familiar lineups for the second or third time.
Late-Season Motivation and Playoff Thresholds
As qualification races narrow, motivation differentials widen between contenders and eliminated sides, and historical records from multiple leagues show elevated scoring in games involving teams with nothing left to play for. Figures released by the National Collegiate Athletic Association track similar late-window effects in conference tournaments where seeding implications drive different tactical approaches than regular-season contests. Observers tracking these thresholds note that spreads and totals adjust more slowly than underlying team news warrants, particularly in sports with extended playoff qualification periods such as European football and North American hockey.
Cross-League Comparisons and Data Integration
Comparative analysis across continents reveals that calendar-driven value appears in consistent locations regardless of sport, though the timing shifts with season length and rest rules. Reports from Australian gaming regulators and Canadian statistical agencies both document how travel-heavy stretches in southern hemisphere summers and northern winters amplify certain betting lines once cumulative fatigue compounds. Integration of weather databases, travel logs, and injury timelines allows sharper identification of spots where markets lag behind schedule realities, especially when leagues resume after international breaks or Olympic pauses.
Conclusion
Calendar progression produces recurring value opportunities because performance variables evolve in documented sequences rather than random bursts, and organizations ranging from academic research centers to regulatory bodies continue to publish datasets that map these movements. Those monitoring league timelines gain access to edges that surface only after initial market reactions settle and actual schedule demands take hold.