Global Hockey Leagues Reveal Seasonal Patterns That Shape Line Values
Ines Walter · Jun 19, 2026
Global Hockey Leagues Reveal Seasonal Patterns That Shape Line Values
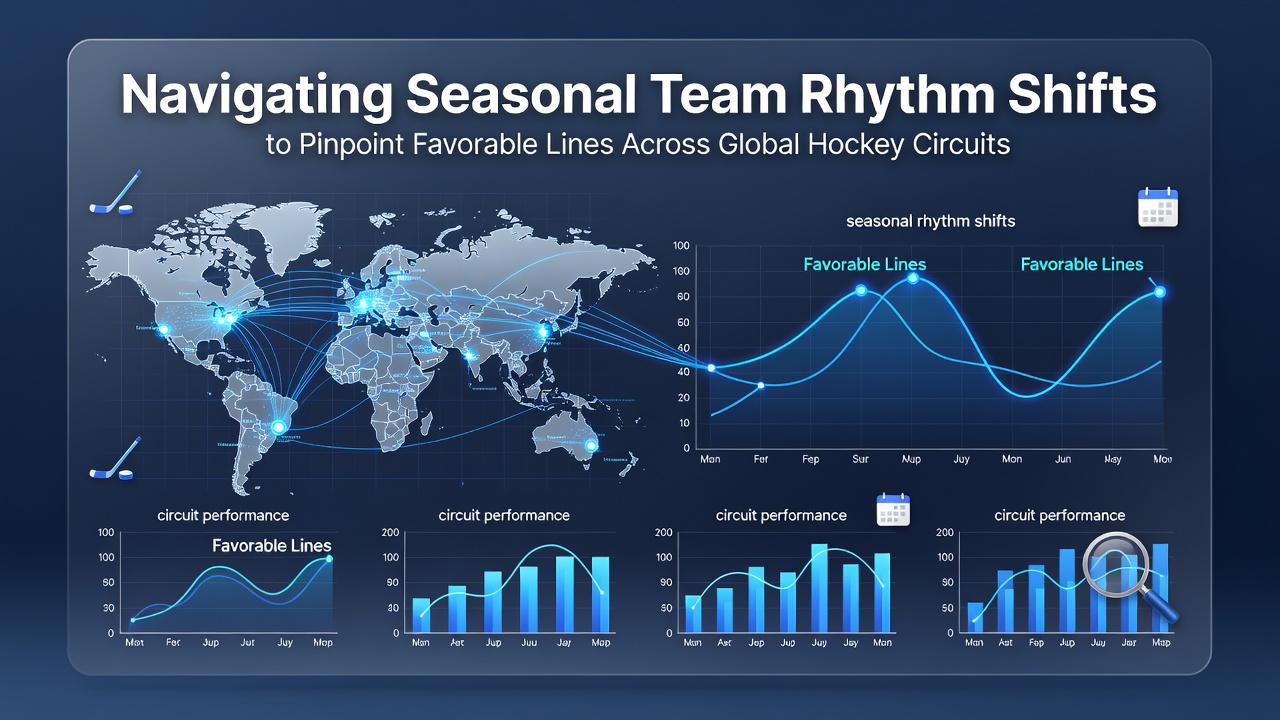
Teams across major hockey circuits experience clear rhythm changes tied to calendar shifts, travel demands, and fixture congestion, and these patterns directly influence how betting lines move in markets covering the NHL, KHL, SHL, and Liiga. Observers note that early-season schedules often feature lighter back-to-backs while mid-winter stretches bring heavier travel loads that alter team output in measurable ways.
Data from league tracking systems shows average goals per game fluctuate by as much as 0.4 across different months, creating windows where totals lines lag behind actual scoring trends. Those who study these circuits point to specific examples where clubs coming off extended road trips post lower expected goal rates in the following home stand, yet oddsmakers adjust slowly because public betting volume favors familiar narratives over granular schedule data.
Calendar Effects Across Major Circuits
North American schedules place heavy emphasis on division play during January and February, while European leagues such as the SHL and Liiga intersperse national team breaks that reset player freshness levels. Researchers tracking performance metrics across these leagues have documented that teams returning from international windows record elevated shot attempt rates in their first three domestic games, a trend that surfaces in player prop markets before totals adjust.
June 2026 sits in the heart of the off-season for most circuits, yet preparatory camps already begin mapping projected lineups and travel budgets that feed into futures pricing. Organizations release preliminary schedules around that period, allowing analysts to map projected rest differentials months in advance and identify early value in season-long totals.
Travel Load and Recovery Windows
Long-haul flights between KHL cities create recovery gaps that differ sharply from the shorter hops common in the NHL. Studies compiled by the International Ice Hockey Federation indicate that teams crossing multiple time zones show measurable drops in even-strength Corsi percentage during the subsequent two games. Bettors who isolate these specific travel sequences often locate discrepancies in moneyline pricing, particularly when the opponent is a rested divisional rival.

European clubs face additional variables during the December holiday period when many leagues schedule condensed rounds. Performance logs reveal that clubs playing three games in five days post lower save percentages from their starting goaltenders, a detail that surfaces in alternate totals markets before main lines fully reflect the fatigue component.
Identifying Favorable Lines Through Rhythm Mapping
Analysts build models that layer schedule density, travel distance, and historical scoring rates to flag lines where the market has not yet incorporated the full rhythm shift. One approach involves comparing a team's current rest advantage against its season-long average, then cross-referencing that figure with opponent recent form. Markets on totals prove especially responsive because public focus tends to remain on star player narratives rather than aggregate rest metrics.
Canadian regulatory filings from provincial gaming authorities document increased handle on NHL player props during January, a month when back-to-back frequency peaks adn line value frequently appears in unders for peripheral skaters. Similar patterns emerge in Swedish and Finnish markets during their respective mid-season breaks, where reduced game volume temporarily alters line movement velocity.
Regional Variations in Market Response
Betting exchanges in Australia and continental Europe display quicker adjustments to schedule-based signals than traditional North American books, according to aggregated trading data. This speed difference creates brief arbitrage windows when KHL or SHL totals move ahead of corresponding NHL lines that share similar rest profiles. Observers tracking these circuits note that the lag narrows once sufficient volume hits the slower markets, yet the initial discrepancy remains exploitable for those monitoring multiple regions simultaneously.
Academic papers from sports science departments at universities in Finland and Canada further support the link between fixture congestion and measurable declines in high-danger chance creation. These findings translate directly into betting models that prioritize unders on total shots or expected goals when teams enter games on short rest following international duty.
Practical Application in Line Selection
Successful navigation requires maintaining updated rest and travel databases for every league, then comparing projected outputs against posted totals and moneylines. Lines on team totals and alternate goal lines often reveal the clearest edges because they incorporate fewer variables than full-game spreads. Those monitoring June 2026 schedule releases already begin building preliminary models that flag potential value once training camp reports confirm roster health and coaching staff preferences for line combinations.
Conclusion
Seasonal rhythm shifts across global hockey circuits produce recurring, quantifiable effects on team performance that translate into line discrepancies when markets update slowly. By layering schedule density, travel data, and regional market behavior, analysts locate favorable positions in totals and player props before public volume forces corrections. The same patterns repeat each season, offering consistent opportunities for those who track the underlying variables across multiple leagues and time zones.