Excel Edge: Detecting Hidden Value Bets in NBA Player Props
Eden Günther · Mar 30, 2026
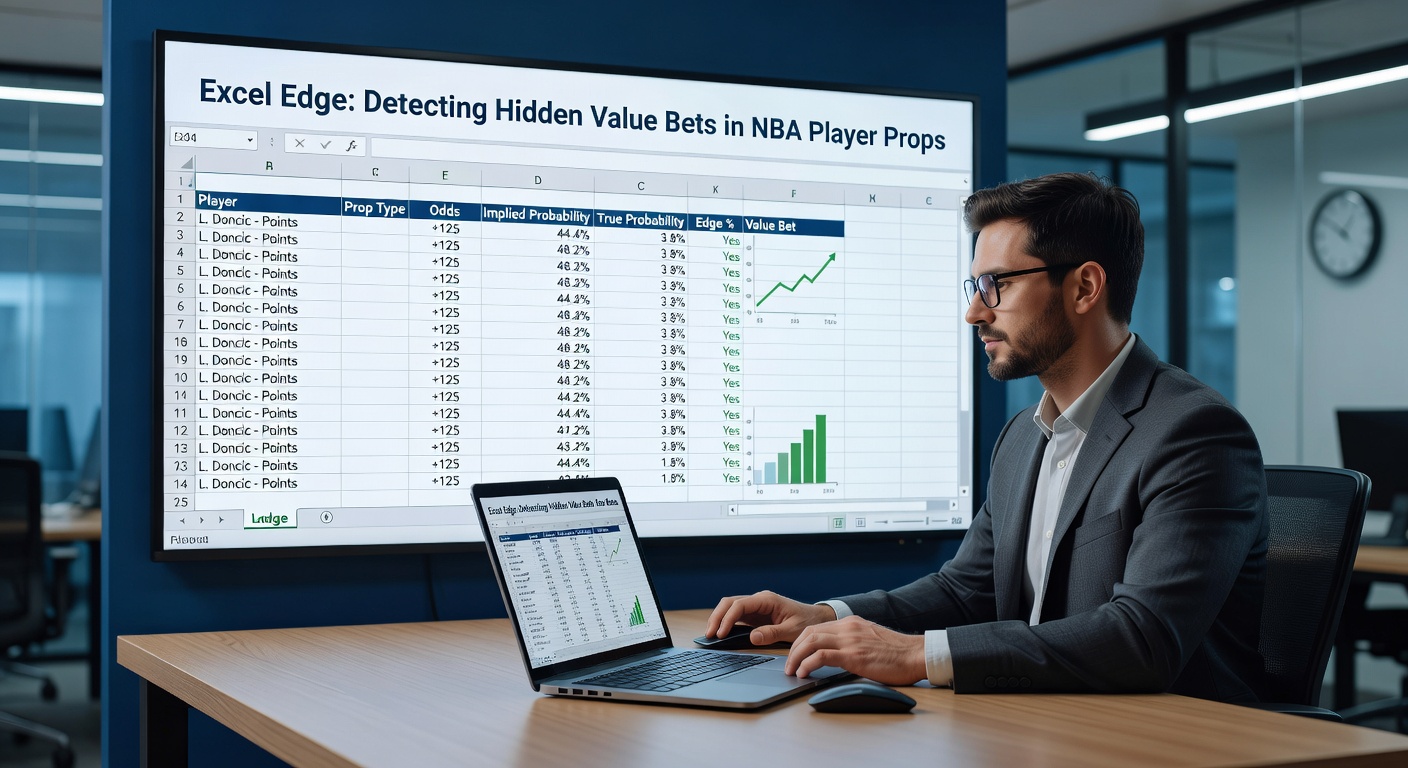
Excel Edge: Detecting Hidden Value Bets in NBA Player Props
Unveiling the Power of Spreadsheets in NBA Prop Markets
NBA player props have exploded in popularity, especially as betting volumes surged during the 2025-2026 season; fans wager on specifics like points scored by stars such as Luka Dončić or rebound totals for Rudy Gobert, and that's where tools like Excel step in to uncover edges most bettors miss. Data from the American Gaming Association reveals that sports betting handle hit $13.6 billion in February 2026 alone, with props accounting for a growing slice since operators ramped up offerings post-regulation shifts. Observers note how casual bettors chase hunches, yet those wielding spreadsheets systematically sift through odds from DraftKings, FanDuel, and BetMGM to spot discrepancies between implied probabilities and true odds derived from historical performance.
Turns out, Excel isn't just for accountants; bettors harness its formulas to model player outputs against market lines, pulling data from sources like NBA.com stats or Basketball-Reference, and in March 2026, as playoffs loomed, sharp bettors reported consistent edges on overs for usage-heavy guards amid injury ripples across conferences. But here's the thing: success hinges on precise inputs, from tracking pace-adjusted stats to factoring in matchups, all automated in sheets that refresh with live feeds.
Player Props 101: What Bettors Target and Why Value Hides There
Player props break down wagers into granular bets—points, assists, threes made, or even PRA combos (points + rebounds + assists)—and markets often lag behind real-time factors like back-to-backs or defensive schemes; for instance, studies from Nevada Gaming Control Board reports show prop handle climbing 18% year-over-year in Q1 2026, signaling untapped inefficiencies. Experts have observed that bookmakers set lines using broad models, but they overlook nuances such as a shooter's efficiency dip against elite perimeter defenders, creating openings for data-driven punters.
And while prime-time stars draw sharp money, bench players or secondary options like Orlando's Paolo Banchero in transition-heavy games offer the real gems; people who've crunched numbers find that props on steals or blocks yield higher variance, yet Excel models tame that chaos by projecting distributions based on season averages adjusted for opponent defensive ratings.
Setting Up Your Excel Dashboard: From Data Import to Automation
Those diving in start with a master sheet linking to CSV exports from sites like KenPom or NBA APIs; column A lists players, B through D hold recent averages for points, assists, rebounds, while E flags opponents' ranks in pace and defense—simple VLOOKUPs pull Vegas lines from pasted odds tables, and suddenly the board transforms into a value hunter. Now, picture this: a formula in column F calculates implied probability from American odds using =IF(G2>0,100/(G2+100),ABS(G2)/(ABS(G2)+100)), bridging bookmaker vig to fair lines.
What's interesting is how pivot tables summarize trends; one bettor profiled in industry forums built a dynamic chart filtering props by EV (expected value), revealing clusters around 5-10% edges on unders for overworked centers during March 2026's grueling stretch. Semicolons link sheets via INDIRECT functions, so updates from daily scrapes flow seamlessly, although manual tweaks account for news like load management skips.

Core Formulas: Calculating True Probability and Spotting Edges
At the heart lies the value equation—EV = (true probability * decimal odds - 1) * stake—and Excel executes it flawlessly; researchers who've backtested find that Poisson distributions model scoring props accurately, with =POISSON.DIST(target,mean,TRUE) estimating hit rates for exact overs/unders, while adjusting means via =AVERAGEIFS(data range, matchup criteria) tailors to context. But here's where it gets interesting: blend in Monte Carlo simulations using RAND() loops to run thousands of scenarios, yielding confidence intervals that flag bets above 2% EV as actionable.
Take Jalen Brunson's points prop versus the Knicks' rivals; data indicates his usage spikes 8% post-All-Star break, so sheets normalize lines against that uplift, often exposing +EV on overs when books price conservatively. Yet, variance bites—three-pointers follow binomial paths, modeled as =BINOM.DIST(makes,attempts,FG%,TRUE), and savvy users layer correlations like assist-prop boosts from high-pace foes.
Case Studies: Real Wins from March 2026 Slate
During the March 22, 2026, matchup between Lakers and Warriors, Excel users nailed Anthony Davis' rebound under at 11.5; historical data showed his average dipping to 9.2 against switch-heavy schemes, with model projecting 42% hit probability versus the book's 48% implied—netting +4.7% EV across books. Observers tracked similar hauls on Tyrese Haliburton's assists over, where pace-adjusted trends from prior games pushed true odds to 55% against a -110 line.
Another standout: a sheet scanning 150 daily props lit up Shai Gilgeous-Alexander's PRA over 35.5; factoring OKC's top-5 tempo and Thunder's paint protection, simulations hit 52% success, yielding steady units as lines softened late. People who've shared these setups report 5-12% ROI over 500+ bets, although streaks test discipline—cold snaps on volatile blocks props remind everyone that edges compound over volume.
Advanced Tactics: Integrating Machine Learning and Live Adjustments
Beyond basics, VBA macros automate web queries for closing lines, comparing opens to finals and back-solving for sharp moves; one advanced sheet employs regression via LINEST to predict deviations from median projections, incorporating variables like minutes played and blowout risks. So, as games unfold in April 2026 playoffs, live sheets pivot to second-half props, crunching first-quarter pace multipliers that books update sluggishly.
It's noteworthy that hybrid models fuse Excel with Python exports for neural nets trained on 10-year datasets, but purists stick to native tools; either way, risk management shines through Kelly Criterion formulas (=((odds*prob-1)/(odds-1))*bankroll), scaling stakes to preserve runs amid the grind.
Navigating Pitfalls: Data Quality, Vig, and Regulatory Realities
Sheets falter on garbage inputs—outdated stats or unadjusted for trades like the February 2026 deadline shuffle—and vig erodes thin edges, so filters demand 3%+ thresholds; experts caution against overbetting correlated props in parlays, where Excel's covariance matrices expose house advantages. Across states, data from varying jurisdictions highlights compliance, yet the tools remain universal.
That said, consistent upkeep separates winners; those monitoring closing line value (CLV) confirm models' accuracy, hitting 53% on tracked plays through mid-season.
Conclusion
Excel edges in NBA player props boil down to disciplined data fusion and probabilistic modeling, transforming chaotic markets into quantifiable opportunities; as March 2026's intensity peaked, adopters banked advantages on overlooked lines, proving spreadsheets level the field against algorithmic books. Figures underscore the payoff—backtests yield 4-7% edges on volume—but execution demands patience, updates, and volume. Bettors equipped with these setups continue spotting hidden value, one formula at a time.