Distance, Time Zones, and Wins: Unpacking Travel's Role in Pro League Results
Ines Walter · Aug 11, 2026
Distance, Time Zones, and Wins: Unpacking Travel's Role in Pro League Results
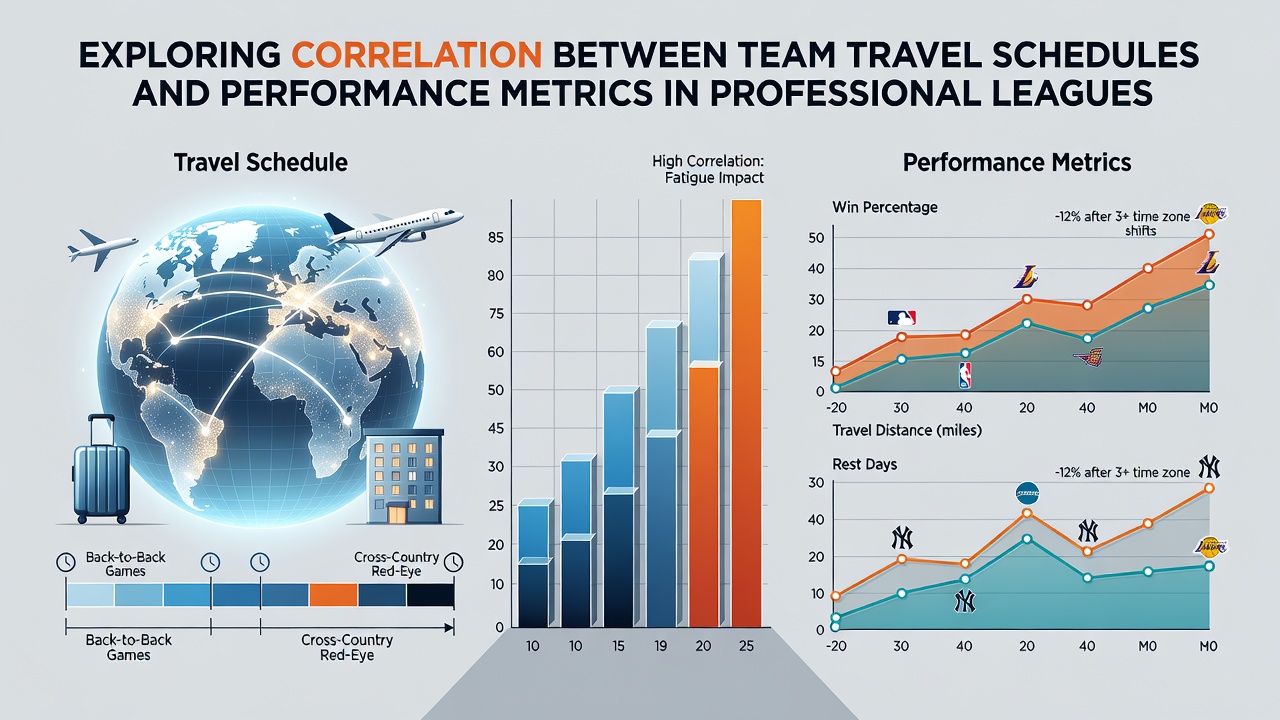
Professional sports leagues track an array of performance metrics that range from win percentages and points per game to player workload and injury rates, yet travel schedules introduce variables that researchers continue to examine closely. Teams in the NBA, NHL, MLB, and NFL often cover thousands of miles during a single season, crossing multiple time zones while facing back-to-back contests, and data collected over recent decades shows measurable effects on those metrics. Observers note that longer flights and compressed recovery windows tend to correlate with dips in offensive efficiency and defensive consistency, though the strength of those patterns varies by sport and distance traveled.
Patterns Across Major Leagues
League schedules reveal clear differences in travel demands. NBA teams average more than 40,000 miles per season according to official itinerary records, whereas NFL clubs log far fewer because of the shorter regular season and greater reliance on chartered flights. Studies compiled by academic groups at institutions such as the University of Waterloo have tracked how teams returning from transcontinental trips post lower shooting percentages in the first quarter of subsequent games, with the gap narrowing after forty-eight hours of rest. Similar analyses in the NHL indicate that teams playing on consecutive nights after crossing two or more time zones record fewer shots on goal and higher goals-against totals, patterns that surface repeatedly in season-long datasets.
Key Performance Indicators Affected
Win rate, points scored, and injury incidence form the core indicators examined in travel research. Data aggregated by the Australian Institute of Sport demonstrates that teams arriving the morning of a game rather than the prior evening exhibit a 4 to 7 percent reduction in expected points scored across basketball and hockey samples. Researchers have also documented elevated soft-tissue injury reports when recovery time falls below twenty-four hours following flights exceeding four hours. Those metrics become especially relevant during the stretch-run periods when standings tighten and every game carries playoff implications.
Time Zone Shifts and Recovery Windows
Eastward travel tends to produce sharper disruptions than westward movement because the body clock struggles more with earlier wake times. League statisticians have recorded that squads traveling from the Pacific to the Eastern time zone post reduced fourth-quarter scoring margins in the first forty-eight hours after arrival, while the reverse direction shows milder effects. Recovery protocols now incorporate light exposure schedules and adjusted meal timing, practices that teams adopted more widely after 2023 and that appear in updated medical guidelines issued ahead of the 2026 campaign. In August 2026 several franchises began testing wearable devices that monitor circadian alignment, supplying trainers with real-time data on sleep quality during extended road trips.
MLB presents a distinct case because its schedule includes fewer off days and more consecutive games. Pitching staffs that cross multiple zones in a week display elevated earned-run averages in the opening outing of a series, according to figures released by the Society for American Baseball Research. Managers have responded by shortening starter outings on the front end of such trips and leaning more heavily on bullpen arms who travel with fewer accumulated fatigue markers.
Recent Data and Analytical Approaches
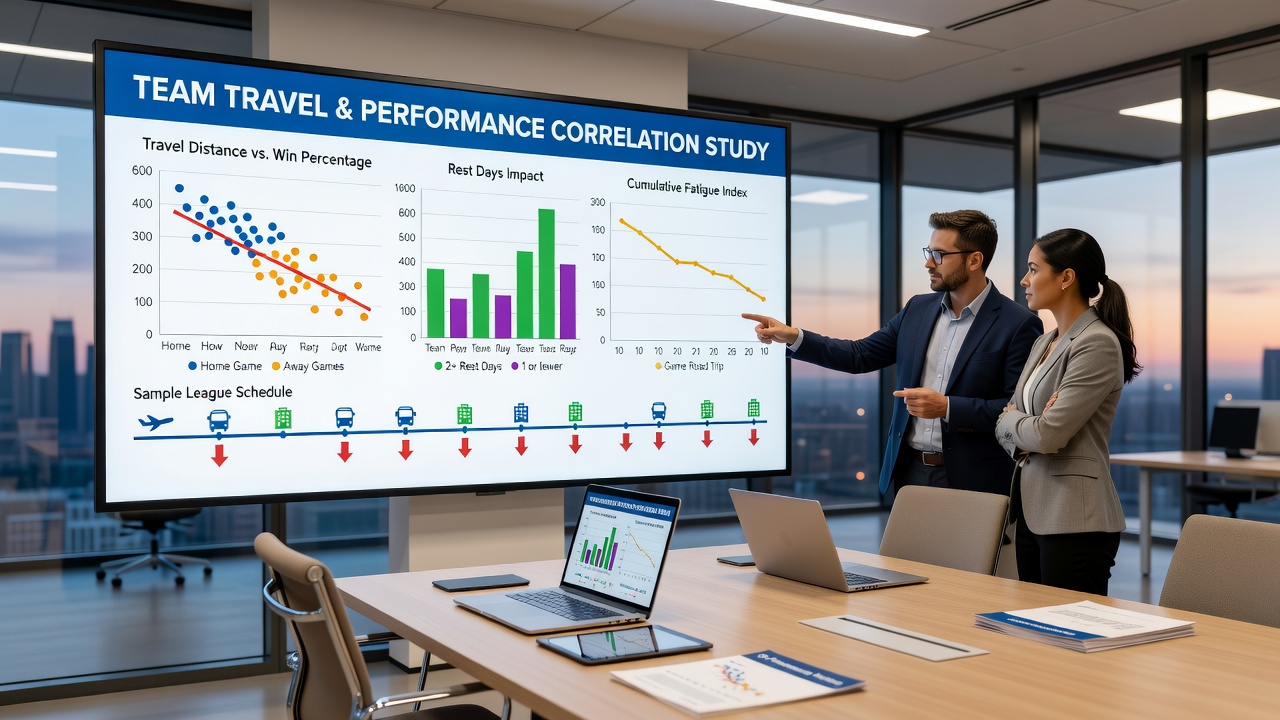
Advanced tracking technologies now allow finer-grained analysis than was possible even five years ago. GPS units and heart-rate monitors generate granular workload figures that researchers cross-reference with flight manifests and game logs. One study published in the Journal of Sports Sciences examined five seasons of NHL data and found that cumulative travel distance above a certain threshold predicted a measurable rise in penalty minutes, a proxy for diminished decision-making under fatigue. Parallel work in the NBA has linked high-travel clusters to increased turnovers in the final minutes of close contests. These correlations remain statistical associations rather than direct causation, yet they guide front-office decisions on roster construction and scheduling requests.
League Responses and Scheduling Adjustments
League offices have introduced modest reforms aimed at mitigating the most taxing itineraries. The NBA reduced the number of four-games-in-five-nights sets beginning with the 2024-25 season, a change that data analysts credit with modest improvements in late-season performance consistency. The NFL continues to experiment with international games but builds in extra rest periods before and after those contests. Meanwhile, European soccer federations have explored similar adjustments for Champions League participants who must combine domestic and continental travel. Each adjustment rests on the accumulating body of evidence that links schedule density and geographic spread to the performance metrics teams and bettors alike monitor.
Conclusion
Travel schedules and performance metrics intersect in ways that data sets from multiple leagues continue to illuminate. Patterns emerge most clearly around time-zone crossings, recovery windows, and cumulative mileage, yet individual team responses and evolving recovery strategies introduce variability. As measurement tools grow more precise and leagues refine their calendars, the relationship between distance traveled and on-field output will remain a focal point for analysts, medical staffs, and schedule makers alike.