Decoding Travel Fatigue Effects on Point Totals in Cross-Country NBA Contests Using Advanced Tracking
Katja Simon · May 22, 2026
Decoding Travel Fatigue Effects on Point Totals in Cross-Country NBA Contests Using Advanced Tracking
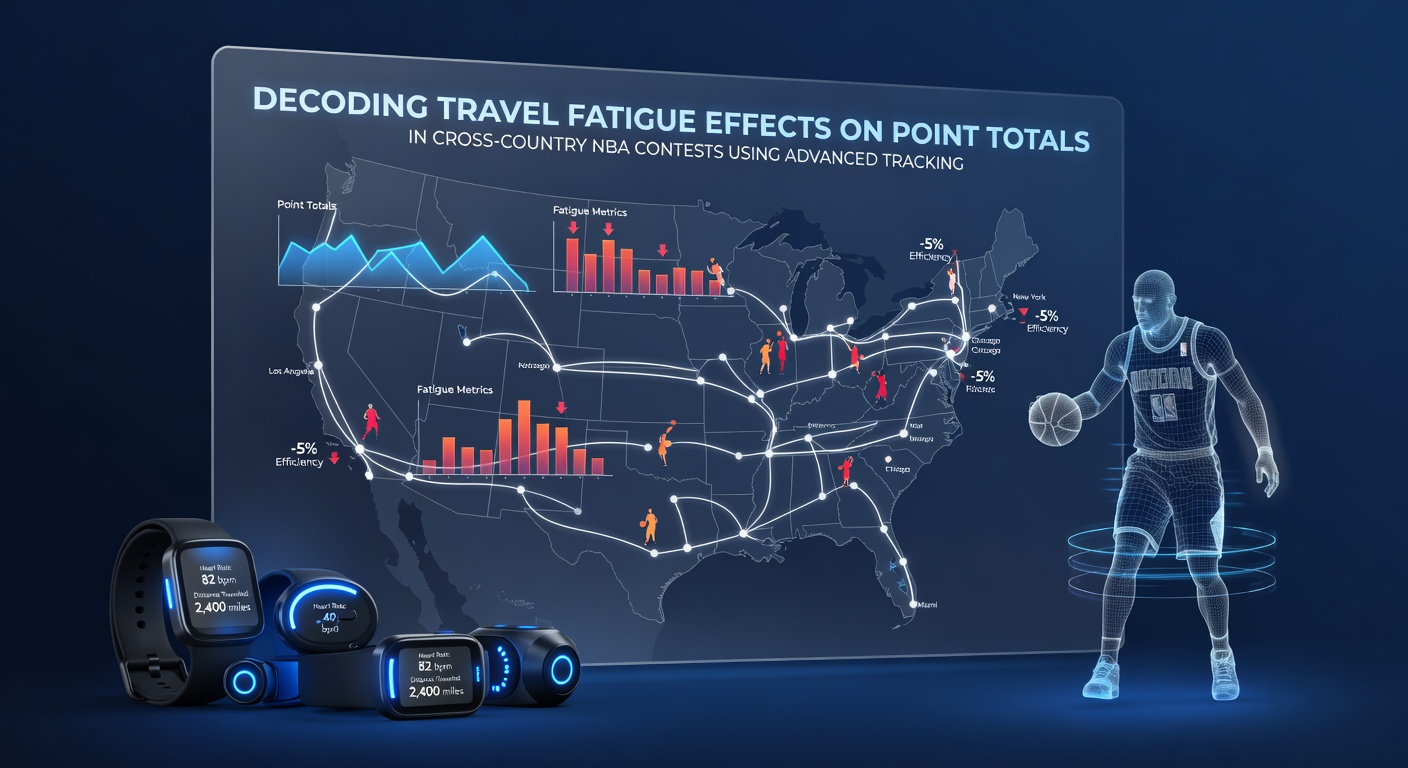
Advanced player tracking systems have transformed how analysts examine performance variables in professional basketball, particularly when teams cross multiple time zones for regular season and postseason matchups. Data collected through optical sensors and wearable devices reveals consistent patterns in player movement, speed, and recovery metrics that correlate directly with changes in game scoring. Observers note these shifts become most pronounced during coast-to-coast travel, where circadian disruption and accumulated physical load alter both offensive efficiency adn defensive intensity.
League-wide figures from the 2025-26 campaign show that teams arriving after flights exceeding three hours tend to post lower average points in the first quarter, with the effect extending into the second half when recovery windows remain limited. Researchers tracking heart rate variability and sleep duration have documented reductions in sprint frequency and lateral quickness among players logging heavy travel minutes, which in turn influences total points allowed and scored. These measurements come from the NBA's integrated tracking platform that records every possession and player action at high resolution.
Tracking Metrics Reveal Fatigue Patterns
Optical tracking combined with biometric data captures distance covered at high speed, acceleration bursts, and changes of direction throughout each contest. When analysts compare games following cross-country flights against those after short regional hops, a measurable decline appears in defensive closeouts and transition opportunities. This decline often compresses scoring margins in early periods while allowing opponents additional easy baskets before fatigue management adjustments take hold.
Studies conducted by university sports science departments have quantified how jet lag compounds these effects, especially on the second night of back-to-back sets. Teams traveling from Pacific to Eastern time zones display slower average reaction times in the opening twenty minutes, according to aggregated sensor readings. The resulting dip in points per possession during that window contributes to lower game totals until players adapt or coaching staffs implement targeted substitution patterns.
Impact on Point Totals and Betting Markets
Betting markets have incorporated travel-adjusted models that factor in recent flight logs and rest differentials when setting totals. Historical data indicates that overs hit at slightly reduced rates in games where one squad has crossed two or more time zones within forty-eight hours, while unders gain traction when both clubs arrive under similar conditions. Advanced tracking adds granularity by identifying which specific players experience the steepest drops in workload capacity, allowing sharper evaluation of team-level scoring projections.
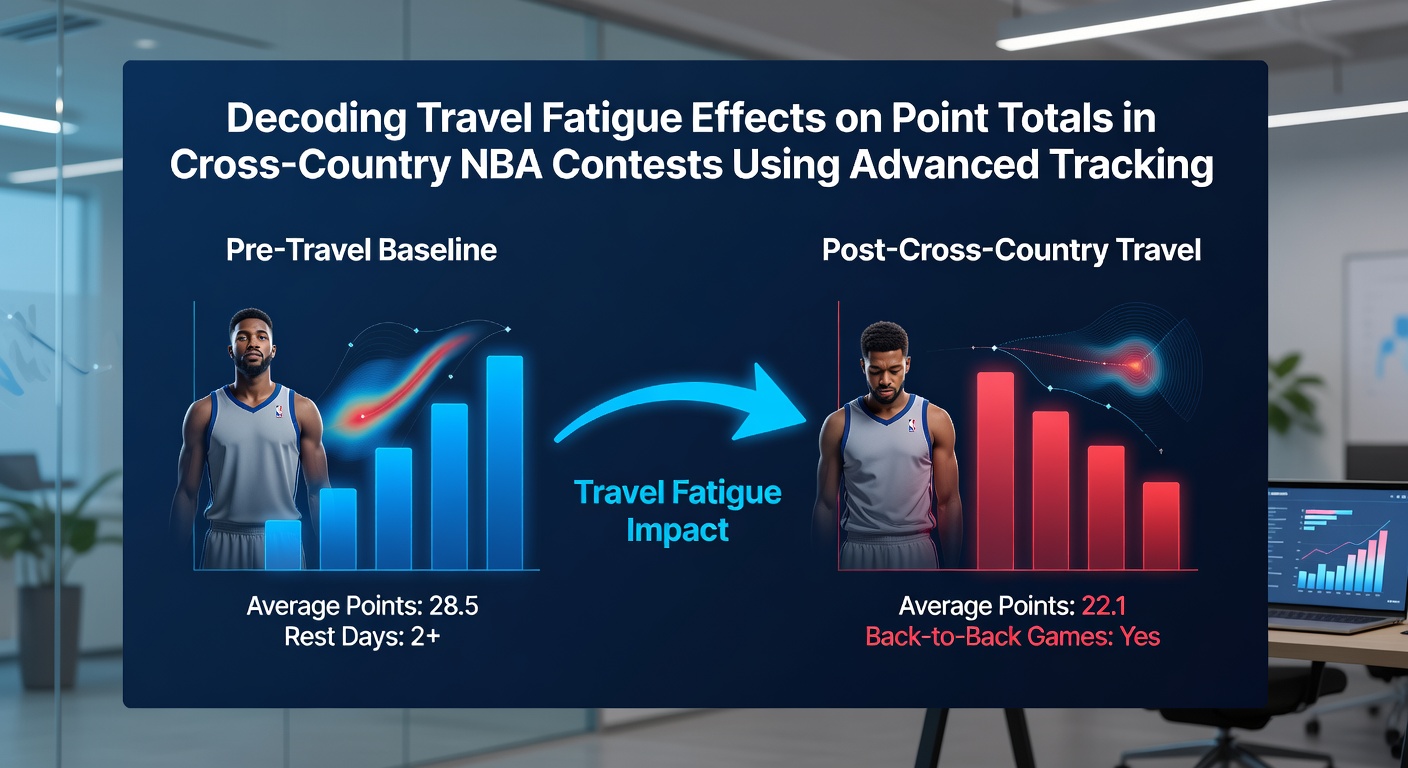
League statistics released in spring 2026 highlight several instances where totals landed below the posted number after extended West Coast to East Coast travel, even when pregame projections accounted for offensive pace. These outcomes trace back to measurable reductions in three-point attempt volume and paint touches once players exceed certain fatigue thresholds tracked by the system. Analysts reviewing possession data find that defensive rotations slow measurably, yet the overall tempo drops enough to offset any potential increase in opponent efficiency.
Regional Examples and Seasonal Trends
West Coast franchises such as the Los Angeles Lakers and Golden State Warriors provide frequent case studies during Eastern Conference road trips. Tracking logs from May 2026 show reduced high-intensity minutes logged by key rotation players after overnight flights, correlating with lower combined scoring outputs against Atlantic Division opponents. Similar patterns surface when Eastern teams head westward, though the direction of travel sometimes produces asymmetric recovery curves depending on game timing and arena conditions.
Coaches and performance staffs now review nightly travel-adjusted reports generated from the same tracking infrastructure that supplies official play-by-play feeds. These reports flag elevated injury risk windows and recommend load management protocols that further influence available minutes and, by extension, expected point production. External sources including academic reviews from the Australian Institute of Sport have examined parallel effects in other professional leagues, confirming that cumulative travel load influences scoring dynamics beyond simple rest-day counts.
Integration With Modern Analytics Platforms
Front offices and independent researchers combine tracking outputs with schedule strength models to refine projections for upcoming slates. The addition of real-time biometric overlays allows more precise differentiation between teams that merely travel versus those whose players show clear physiological strain. In turn, these layered datasets support more accurate forecasts of game totals, particularly during stretches when multiple cross-country contests occur within a single week.
Data from the NBA's official statistics portal continues to feed these models with updated possession and movement figures each night. Observers tracking seasonal trends note that the magnitude of scoring suppression varies by roster construction, with younger or deeper benches sometimes mitigating fatigue effects more effectively than veteran-heavy lineups.
Conclusion
Advanced tracking has established clear, quantifiable links between cross-country travel and shifts in NBA point totals. Sensor-derived metrics on workload, recovery, and movement efficiency supply objective evidence that informs both team preparation and market analysis. As the 2025-26 season progresses into its final weeks, these data streams remain central to understanding how travel shapes contest outcomes across different time zones and schedule densities.