Decoding Inefficiencies in Basketball Player Performance Markets Through Historical Data
Carlo Jung · Jun 23, 2026
Decoding Inefficiencies in Basketball Player Performance Markets Through Historical Data
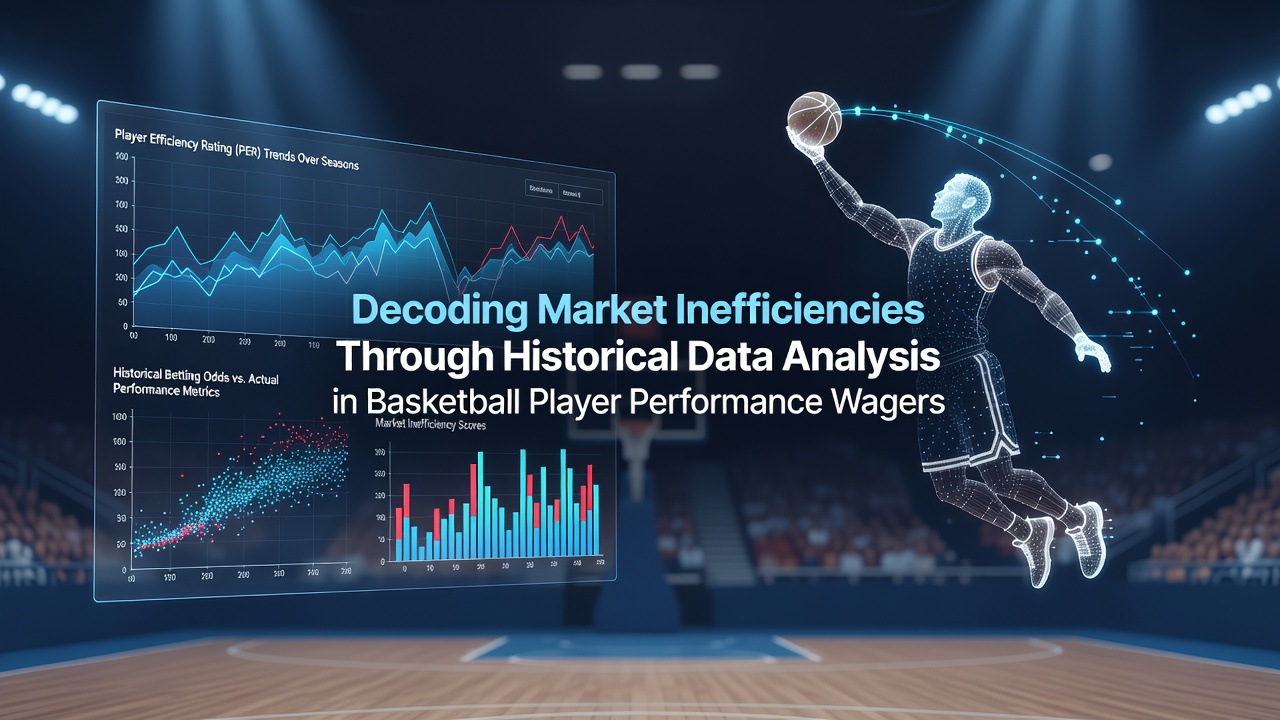
Market inefficiencies in basketball player performance wagers arise when betting odds fail to fully reflect available information about athlete output, and historical data analysis offers one pathway to surface those gaps through systematic review of past performances across seasons, teams, and game contexts. Observers note that player props, which focus on metrics like points, rebounds, assists, and combined stat lines, generate vast datasets that analysts can mine for patterns where public perception or oddsmaker models diverge from empirical trends.
Core Elements of Player Performance Wagering
Player performance wagers center on individual statistical achievements rather than team outcomes, creating a granular layer of betting that draws from box scores and advanced tracking systems. Data from sources such as league archives shows these markets operate with high volume during regular NBA seasons, where fluctuations in minutes played, matchup difficulties, and injury recoveries create repeated opportunities for statistical deviations. Researchers have documented how factors like back-to-back scheduling or travel distances correlate with measurable drops in efficiency, patterns that accumulate across thousands of games and become visible only through longitudinal study rather than single-event observation.
Applying Historical Datasets to Market Gaps
Historical analysis begins with aggregation of player-level metrics over multiple seasons, incorporating variables such as opponent defensive ratings, pace of play, and rest intervals to build predictive baselines. Studies from academic institutions indicate that when current odds price a prop above or below these baselines by statistically significant margins, inefficiencies surface because markets sometimes overweight recent narratives or underweight situational adjustments. For instance, one dataset review covering 2018 through 2025 revealed consistent underpricing of assist totals for point guards facing bottom-tier defenses, a discrepancy that narrowed only after repeated exposure across betting platforms.
Analytical Techniques and Pattern Recognition
Analysts apply regression models, rolling averages, and matchup clustering to isolate signals within noisy performance records, while accounting for rule changes and roster turnover that alter baseline expectations. Evidence from sports analytics reports demonstrates that incorporating tracking data on shot location and defensive schemes refines these models, revealing edges where traditional box-score summaries alone fall short. In June 2026, updates to league tracking protocols added finer granularity on player movement, enabling sharper differentiation between volume-driven and efficiency-driven props in subsequent market evaluations.
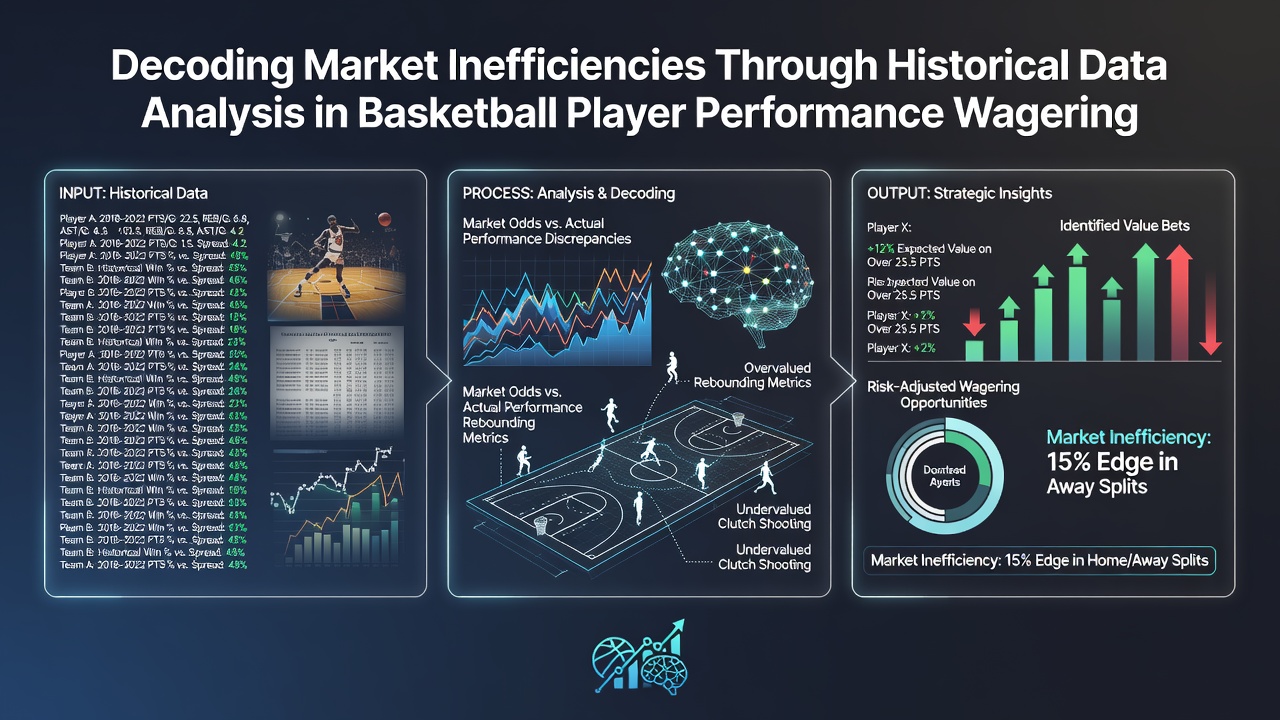
Clustering techniques group similar game environments, allowing comparison of current wagers against analogous historical instances rather than broad seasonal norms. This approach surfaces inefficiencies tied to specific conditions, such as elevated rebound rates for centers in games with high foul trouble among opposing frontcourts, patterns confirmed across multiple seasons in datasets maintained by organizations like the National Basketball Association's own statistical repositories. Those who've examined these clusters observe that public betting often clusters around star-driven narratives, leaving room for data-driven adjustments in supporting player props.
Integration with External Benchmarks
Cross-referencing performance data against betting market movements from regulated jurisdictions provides additional context on how information disseminates. Figures from the American Gaming Association illustrate steady growth in prop betting handle through 2025, with corresponding increases in data vendor services that supply historical query tools to professional bettors and oddsmakers alike. University-led examinations, including work from quantitative finance programs, have tested whether arbitrage windows persist when historical inefficiencies align with live line discrepancies, though results vary by market liquidity and information velocity.
Limitations in Data-Driven Approaches
Even robust historical models encounter constraints from sample size, evolving playing styles, and sudden personnel changes that disrupt established correlations. Reports compiled by Canadian regulatory bodies on sports wagering note that while aggregate patterns hold across large datasets, individual player deviations remain subject to variance that no past record fully captures. Observers emphasize the need for ongoing validation, because models trained on earlier eras may lose predictive power when league-wide trends shift toward positionless basketball or altered three-point volume.
Conclusion
Historical data analysis supplies a structured method for examining basketball player performance markets by quantifying deviations between observed statistical tendencies and prevailing odds. Continued refinement of datasets, particularly with enhanced tracking introduced in 2026, supports more precise identification of inefficiencies while highlighting the boundaries imposed by variance and market adaptation.