Charting Seasonal Pattern Shifts to Refine Position Sizing Models Across International Rugby Markets
Ines Walter · Aug 14, 2026

Charting Seasonal Pattern Shifts to Refine Position Sizing Models Across International Rugby Markets
International rugby markets display distinct seasonal cycles that influence odds movement and betting volumes, and analysts have tracked these rhythms to adjust position sizing models accordingly. Data from major competitions such as the Six Nations, Rugby Championship, and autumn tests reveal recurring shifts in team performance metrics tied to fixture timing, travel demands, and weather conditions across hemispheres.
Position sizing models rely on probability estimates and bankroll allocation rules, yet these calculations gain precision when seasonal factors enter the framework. Researchers at sports analytics firms have compiled match-level statistics spanning multiple years, showing that win rates and margin distributions vary systematically between early-season fixtures and end-of-campaign encounters.
Understanding Seasonal Cycles in Rugby Competitions
Northern hemisphere leagues typically peak between February and May while southern competitions reach their height from July through October, creating staggered windows that affect cross-border betting liquidity. Observers note that injury accumulation rates climb after the midpoint of each campaign, altering expected outcomes and prompting bettors to recalibrate stake sizes based on updated team depth charts.
Travel fatigue emerges as a measurable variable during multi-week tours, where teams crossing time zones exhibit documented declines in lineout success and scrum stability. Models that incorporate these variables produce allocation percentages that differ from static approaches, with smaller fractions directed toward matches occurring late in extended tours.
Data Sources and Pattern Identification Methods
Comprehensive datasets from World Rugby and national unions supply the raw inputs for pattern detection, including player workload logs and historical weather records at match venues. Analysts apply time-series techniques to isolate seasonal components from random variation, revealing that home advantage coefficients strengthen during cooler months in certain regions.
One study covering 2018 through 2025 demonstrated that position sizing adjustments based on these seasonal signals reduced drawdown periods in simulated portfolios compared with fixed-percentage strategies. The same analysis highlighted how forward-dominant playing styles gain relative edge during wet-weather phases common in March and April in Europe.
Refining Allocation Rules with Seasonal Inputs
Position sizing frameworks such as fractional Kelly or volatility-adjusted methods receive additional layers when seasonal pattern scores are integrated. Bettors assign multipliers to base probabilities according to the phase of the competition cycle, then apply the resulting edge to determine stake percentages.
During August 2026, upcoming international windows will include preparatory matches ahead of the next global tournament cycle, offering fresh data points that can test whether established seasonal correlations persist. Early indicators from training camp reports suggest continued emphasis on set-piece accuracy, which models can weight more heavily in allocation decisions.
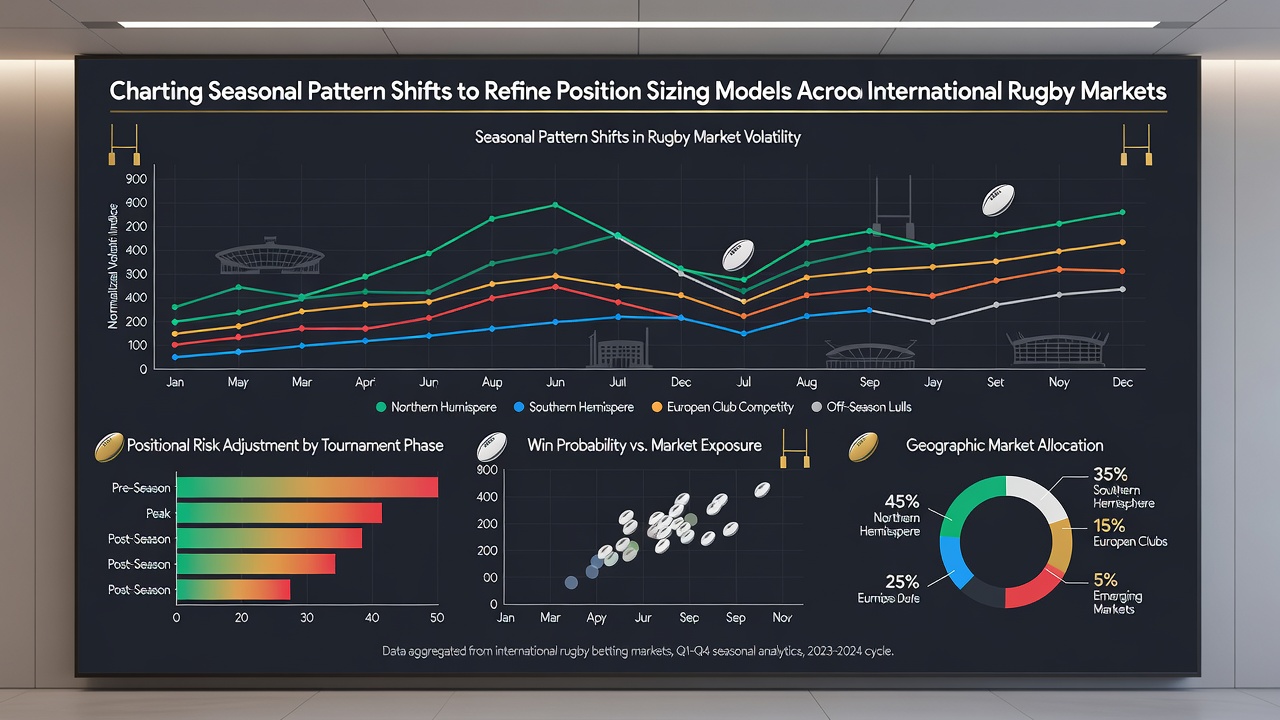
Market liquidity also follows seasonal contours, with higher volumes concentrated around championship deciders and lower activity during mid-year friendlies. Position sizing models that scale exposure to available liquidity help maintain consistent execution prices across varying market depths. Australian research institutes tracking southern hemisphere competitions have published reports showing similar liquidity patterns tied to broadcast schedules and national team availability.
Case Examples from Recent Seasons
Take the 2024 Rugby Championship where late-season altitude matches in South Africa produced larger point spreads than early rounds, prompting model users to reduce stake sizes on visiting teams. Observers documented that teams with superior recovery protocols maintained closer margins, allowing refined sizing rules to capture value in specific subsets of fixtures.
Another instance emerged during the 2025 Six Nations, when prolonged wet spells in the final two rounds shifted scoring distributions downward. Models incorporating precipitation forecasts adjusted probability inputs and lowered recommended position sizes on high-scoring outcomes, aligning allocations more closely with realized results.
Those who have examined betting records across multiple markets find that combining seasonal pattern detection with traditional metrics improves risk-adjusted returns in backtests. The approach requires ongoing validation because coaching changes and rule adjustments can alter historical relationships.
Conclusion
Seasonal pattern charting supplies an additional dimension for position sizing models operating in international rugby markets. By embedding competition-phase variables, travel metrics, and weather influences into allocation logic, practitioners obtain more responsive stake recommendations that reflect documented cycles in team performance and market behavior. Continued collection of match data through 2026 and beyond will allow further calibration of these frameworks across diverse geographic and competitive contexts.